Minitab® Tutorial - TABTRAINER® VOLUME 2: CORRELATION AND REGRESSION €99,99
Click here to view all payment options!
Minitab Correlation and Regression Course in English
Minitab correlation and regression course: This US-English online training by TABTRAINER® explains how relationships between variables can be analyzed, modeled and interpreted. The course covers correlation, simple regression, multiple regression, polynomial regression and systematic model reduction using backward elimination.
The training is designed for engineers, scientists, quality professionals, process owners and Six Sigma practitioners who want to use statistical models for data-driven decision-making. Practical examples demonstrate how relationships can be visualized, quantified and translated into reliable conclusions for quality management, production, research and process improvement.
Topics covered in the Minitab correlation and regression course
- graphical analysis of relationships between variables
- scatterplots and matrix plots
- correlation coefficients and their interpretation
- simple linear regression
- regression equations and fitted values
- coefficient of determination and adjusted R-squared
- confidence intervals and prediction intervals
- residual analysis and model diagnostics
- multiple regression with several predictors
- assessment of individual predictor effects
- multicollinearity and relationships between predictors
- polynomial regression for nonlinear relationships
- quadratic and higher-order model terms
- backward elimination of non-significant predictors
- hierarchical model reduction
- interpretation and communication of regression results
Correlation and simple linear regression
The first part of the course explains how the strength and direction of a relationship between two variables can be evaluated. Scatterplots and correlation coefficients are used to identify linear patterns, unusual observations and possible limitations of the analysis.
Simple linear regression is then used to describe the relationship mathematically. Participants learn how to interpret the regression equation, slope, intercept, significance values and confidence intervals. The course also explains the difference between estimating the mean response and predicting an individual future observation.
Multiple regression and matrix plots
Multiple regression extends the analysis to several predictor variables. The course demonstrates how multiple influences can be assessed simultaneously and how the contribution of each predictor is interpreted while the other variables are held constant.
Matrix plots support the graphical assessment of relationships between predictors and responses. Participants learn how to identify potentially redundant variables, recognize multicollinearity and evaluate whether the selected predictors provide a technically meaningful model.
Polynomial regression and backward elimination
When relationships are not adequately described by a straight line, polynomial regression can be used to model curvature. The Minitab correlation and regression course shows how quadratic and higher-order terms are introduced, evaluated and interpreted.
Backward elimination is used to simplify models that initially contain several predictors or polynomial terms. Non-significant terms are removed step by step while maintaining the hierarchical structure of the regression model. Participants learn how to compare model quality and avoid unnecessary complexity.
Model diagnostics and reliable interpretation
A regression model should not be evaluated solely by its R-squared value. The course therefore includes residual analysis, checks for unusual observations and an assessment of the statistical model assumptions. Participants learn how residual plots support the detection of nonlinearity, non-constant variance and other potential model weaknesses.
The focus is not limited to operating the software. Each analysis is explained in terms of its statistical purpose, assumptions and practical interpretation. This enables participants to decide whether a model is technically plausible and sufficiently reliable for prediction or process improvement.
Practical online training with permanent access
The course contains more than two hours of US-English video instruction. Practical examples and downloadable datasets allow participants to reproduce the analyses independently and compare their own results with the procedures demonstrated in the lessons.
After purchase, access remains permanently available without recurring subscription fees. The course can be completed flexibly on a PC, tablet or smartphone and later used as a reference for practical projects.
Your benefits
- US-English online training
- structured coverage of correlation and regression methods
- practical examples from quality and process improvement
- downloadable exercise datasets
- step-by-step model interpretation
- permanent access after purchase
- one-time payment without recurring fees
- suitable for engineers, scientists and Six Sigma practitioners
Explore additional TABTRAINER® courses
An overview of further training in fundamentals, measurement system analysis, process stability, process capability and design of experiments is available in the
TABTRAINER® course overview.
There you can compare the individual modules and complete training packages.
- 14 SIMPLE CORRELATION AND SIMPLE REGRESSION
- 15 MULTIPLE CORRELATION ANALYSIS, MATRIX PLOT
- 16 POLYNOMIAL REGRESSION
- 17 POLYNOMIAL REGRESSION WITH BACKWARD ELIMINATION
14 SIMPLE CORRELATION AND SIMPLE REGRESSION
14 SIMPLE CORRELATION AND SIMPLE REGRESSION
In the 14th Minitab tutorial, we visit the heat treatment facility at Smartboard Company. Here the skateboard axles are subjected to heat treatment, in order to achieve the material strength required by the customer. In addition to the heat treatment parameters, the copper content in the skateboard axles also has an influence on the material strength. Against this background, this Minitab tutorial will investigate the relationship between copper content and material strength, on the basis of existing historical process data. For this purpose, we will first use a simple correlation analysis in this Minitab training, to investigate whether a reciprocal relationship can be established between the amount of copper in the material, and the axle material strength. If this is the case, we will use a simple regression analysis to show which copper content is ultimately required to achieve the material strength desired by the customer. As part of our correlation analysis, we will become familiar with the important Pearson correlation factor, in order to obtain a quantitative statement, as to whether the relevant influencing factors correlate weakly, strongly, or not at all. In this context, we will learn the basic principle of correlation analysis, based on the method of least squares, in detail by actively calculating a complete correlation analysis step by step by using a simplified data set, in order to understand how the results in the output window were obtained. Finally, we can use a simple regression analysis, to describe our technical problem with a mathematical regression equation, in order to predict future material strengths, as a function of the influencing factor copper content, with a high prediction quality.
MAIN TOPICS MINITAB TUTORIAL 14
- Simple correlation analysis according to Pearson
- Correlation matrix
- Table of „pairwise correlations“
- Hypothesis test for pairwise correlation according to Pearson
- Working with „drawing tools“ in the context of the matrix plot
- Simple regression analysis
- Adjusting regression model
- Least squares method
- Interpretation of fitted line plot
- Residual analysis as part of the regression
- Confidence intervals and prediction intervals
- Predicting the response variable by using the regression model
Trailer
15 MULTIPLE CORRELATION ANALYSIS, MATRIX PLOT
15 MULTIPLE CORRELATION ANALYSIS, MATRIX PLOT
In the 15th Minitab tutorial, we are on the high-speed test track of Smartboard Company. On this outdoor test track, which stretches downhill over several kilometers, the skateboards developed for speed records are tested. The maximum speed achieved on the test track is recorded using light barriers along the track. Ten skateboard pilots with different riding qualities are available as test riders representing the different riding behavior of the entire customers. In order to reduce the very high personnel costs for the ten test pilots in the future, we will accompany the team in this Minitab training session as they use a multiple correlation analysis to work out which of the ten test pilots have identical speed profiles. The key objective in this training session will be, to identify possible strong correlations between quantitative factors using pairwise correlation analysis. We will get to know the useful correlation matrix, which is often simply referred to as matrix plot, in day-to-day business. And we will see, how we can use the matrix plot to obtain an efficient qualitative overview of the potential correlation trends between the test pilots. Building on this, we will move on to the actual Pearson correlation analysis, in order to substantiate our findings from the correlation matrix. Finally, we will use the corresponding significance values from the „Pearson pairwise correlation“ hypothesis test, to assess the statistical significance of the correlations again with a 95% confidence level.
MAIN TOPICS MINITAB TUTORIAL 15
- Multiple correlation analysis according to Pearson
- Interpreting the correlation matrix
- Interpreting the table of „pairwise correlations“
- Set up the corresponding hypothesis tests
- Pairwise correlation analysis according to Pearson
Trailer
16 POLYNOMIAL REGRESSION
16 POLYNOMIAL REGRESSION
In the 16th Minitab tutorial, we are once again in the heat treatment department at Smartboard Company. Due to the current high order situation, the heat treatment plant is currently a bottleneck unit, and the quality team should therefore investigate whether it is possible to achieve the axle strength previously required by customers even with reduced annealing times by increasing the annealing temperature. By increasing the annealing temperature, the annealing times of the skateboard axles in the heat treatment plant could be shortened, so that more axles can be heat treated faster. In this Minitab course, we will first determine the corresponding Pearson correlation factors using a simple correlation analysis. Based on these findings, we will apply the useful so-called polynomial regression analysis, to mathematically model the reciprocal relationships between influencing variables and the response variable. Starting from a linear model, we will first generate a quadratic, and then a cubic model, and compare them with each other. Using the corresponding residual diagrams, we will examine why a cubic regression equation is preferable to a linear or quadratic regression equation in this training unit. Finally, we will enter into the very useful interactive response variable optimization, and with our previously determined regression equation, we will be able to determine the required best possible parameter settings with a 95% certainty within the framework of the response variable optimization.
MAIN TOPICS MINITAB TUTORIAL 16
- Polynomial regression
- Correlation analysis
- Correlation matrix
- Table of „pairwise correlations“
- Hypothesis test as part of the pairwise correlation analysis according to Pearson
- Reference lines in the matrix plot
- Polynomial regression
- „4 in 1“ – residual diagram
- Quadratic and cubic regression models
- Response variable optimization in the context of regression analysis
- Confidence and prediction intervals in the context of the regression analysis
Trailer
17 POLYNOMIAL REGRESSION WITH BACKWARD ELIMINATION
17 POLYNOMIAL REGRESSION WITH BACKWARD ELIMINATION
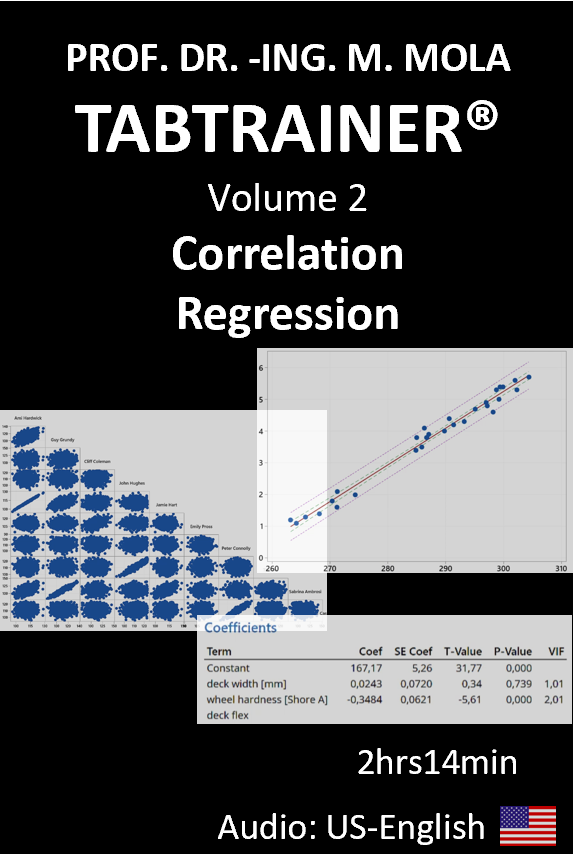
In the 17th Minitab tutorial, we visit the Smartboard Company high-speed test track again. On this outdoor test track, which stretches downhill over several miles, the influence of the following parameters on the maximum achievable speed of a skateboard prototype is to be tested: The deck width in millimeters, the so-called deck flex as a measure of the elasticity of the skateboard decks in the two stages medium and hard, as well as the wheel hardness. The wheel hardness is determined according to the standardized Shore hardness test method. A metal pin with a geometrically standardized truncated cone tip, and a standardized spring force, and application time is pressed into the wheel surface. The greater the resistance of the skateboard wheel to the penetration of the metal pin the greater the hardness value achieved. The central aim of this Minitab tutorial is to find out which of the three influencing variables, also known as predictors, have a significant effect on our response variable – in this case the wheel hardness. To do this, we will first work with the so-called matrix plot to create a visual overview of possible trends and tendencies in advance. We will then use Pearson’s correlation factor to numerically assess the characteristics of the trends and tendencies identified, and derive our corresponding variance model using polynomial regression analysis. As part of the evaluation of our variance model based on the classic quality parameters, we will become familiar with other quality parameters in this context, such as the PRESS value, or the Mallow cp value. We will then get to know the „backward elimination“ method, which is very important for model adjustment in order to remove non-significant terms from our variance model. Finally, we will learn about the very helpful and efficient option of automated backward elimination, and the regression of the best subsets, so that we can finally use the available results to make a statement about the extent to which the respective influencing variables affect the roll hardness.
MAIN TOPICS MINITAB TUTORIAL 17
- Polynomial regression with backward elimination
- Correlation matrix
- Editing the correlation matrix
- Correlation analysis according to Pearson
- Table of „pairwise correlations“
- Analysis of the residual scatter
- Automated backward elimination
- Table Regression of the best subsets
- Quality parameters PRESS, Mallows-Cp, AICc, BIC