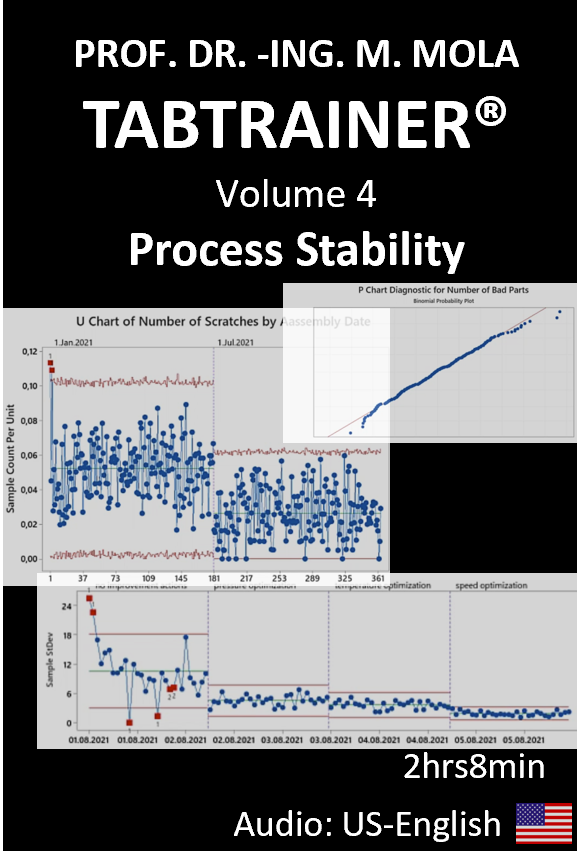
Minitab® Tutorial - TABTRAINER® VOLUME 4: PROCESS STABILITY €99,99
Click here to view all payment options!
Minitab Control Charts Course in English
Minitab control charts course: This US-English online training by TABTRAINER® explains how statistical control charts are used to evaluate process stability and identify unusual process variation. The course covers control charts for continuous and attribute data and combines statistical fundamentals with practical examples from quality management and production.
The training is designed for engineers, scientists, quality professionals, process owners and Six Sigma practitioners who need to distinguish common-cause variation from special-cause variation. Participants learn how suitable control charts are selected, created and interpreted and how statistically significant signals can be translated into practical process investigations.
Topics covered in the Minitab control charts course
- fundamentals of statistical process control
- common-cause and special-cause variation
- selection of suitable control charts
- control charts for continuous data
- individuals and moving range charts
- Xbar and range charts
- Xbar and standard deviation charts
- rational subgrouping
- center lines and control limits
- interpretation of points outside the control limits
- tests for non-random patterns and special causes
- control charts for proportions and defectives
- P charts and NP charts
- control charts for defects
- C charts and U charts
- assessment of process stability
- practical interpretation of control-chart signals
Control charts for continuous data
Control charts for continuous data are used when the measured characteristic can take numerical values on a continuous scale. The course explains how individuals charts, moving range charts and subgroup-based control charts are selected according to the available data structure.
Participants learn how center lines and control limits are calculated and how the chart reflects the expected variation of a stable process. The lessons also explain why specification limits and statistical control limits serve different purposes and must not be confused.
Rational subgrouping and process variation
The correct formation of subgroups is essential for meaningful statistical process control. Rational subgrouping helps separate short-term variation within a subgroup from variation occurring between subgroups over time.
The Minitab control charts course demonstrates how subgroup size, sampling frequency and data sequence influence the interpretation of a control chart. Participants learn how inappropriate subgrouping can conceal process changes or produce misleading signals.
Control charts for attribute data
Attribute control charts are used when products or process results are classified or counted rather than measured continuously. P charts and NP charts evaluate the proportion or number of nonconforming units. C charts and U charts are used to monitor the number of defects.
The course explains how the appropriate chart depends on the type of attribute data and whether the sample size remains constant or changes between observations. Practical examples show how control limits are interpreted and how unusual changes in defect levels can be detected.
Identifying special causes and non-random patterns
A process may show statistically relevant signals even when no point lies outside the control limits. The training therefore also covers tests for trends, shifts, cycles and other non-random patterns.
Participants learn how these signals can indicate changes in materials, machines, operators, environmental conditions or operating procedures. The objective is not merely to identify a signal but to connect the statistical result with a structured technical investigation.
Process stability as a prerequisite for capability analysis
Process capability should only be assessed meaningfully when the process is sufficiently stable. A capability index cannot compensate for uncontrolled process variation. The course therefore explains the relationship between statistical process control and subsequent capability analysis.
The Minitab control charts course supports participants in deciding whether a process can be treated as statistically stable and whether the available data provide a reliable basis for further analysis and improvement.
Practical online training with permanent access
The course contains several hours of US-English video instruction. Step-by-step demonstrations and practical datasets allow participants to reproduce the analyses independently and compare their own results with the procedures shown in the lessons.
After purchase, access remains permanently available without recurring subscription fees. Individual lessons can be repeated at any time and used later as a reference when monitoring production or quality processes.
Your benefits
- US-English online training
- control charts for continuous and attribute data
- practical explanation of SPC principles
- selection and interpretation of suitable chart types
- identification of special causes and non-random patterns
- downloadable exercise datasets
- permanent access after purchase
- one-time payment without recurring fees
- suitable for quality professionals and Six Sigma practitioners
Explore additional TABTRAINER® courses
Further online training in statistical fundamentals, regression, measurement system analysis, process capability and design of experiments is available in the
TABTRAINER® course overview.
There you can compare the individual modules and complete course packages.
- 24 CONTROL CHARTS, CONTINUOUS DATA, PART 1
- 24 CONTROL CHARTS, CONTINUOUS DATA, PART 2
- 24 CONTROL CHARTS, CONTINUOUS DATA, PART 3
- 25 PROCESS STABILITY ATTRIBUTIVE DATA: P-, NP-, P`- CHART
- 26 PROCESS STABILITY ATTRIBUTIVE DATA: U-, C- CHART
24 CONTROL CHARTS, CONTINUOUS DATA, PART 1
24 CONTROL CHARTS, CONTINUOUS DATA
In the 24th Minitab tutorial, we are in the die-casting production facility of Smartboard Company. Skateboard axles are manufactured here by using two die-casting systems. The central quality feature of the skateboard axles, is the axle strength. Smartboard Company’s customers require an average axle strength of 400 megapascals, plus minus five megapascals. As part of this training session, we will accompany the Smartboard Company quality team and experience, how the corresponding quality control charts are used to analyze, whether the die casting process can be classified as a stable process, in terms of the customer specification and in terms of the Automotive Industry Action Group standards, AIAG. We will see how the quality team first uses descriptive statistics to gain an initial impression of the average process situation and process variation, before the actual process stability analysis and then evaluates the quality of the process stability, by using corresponding quality control charts. We will learn that different types of quality control charts are used, depending on the scale level and subgroup size. In this context, we will first deal with the scattering behavior of individual values and mean values, by using a simple data set in order to better understand the so-called statistical parameter standard error. We will become familiar with the so-called quality individual chart, also known as the I chart, the mean value chart Xbar chart, and the standard deviation chart, known as the s-chart. For didactic reasons, we will also manually calculate the respective upper and lower control limits in the quality control charts step by step for better understanding, and compare them with the results in the output window. On this occasion, we will also use the so-called Range chart, also known as the R-chart. And also, manually derive the corresponding control limits for this. We will then learn in detail the eight most important control tests established in the industry, based on the Automotive Industry Action Group standards AIAG, which can help us to detect any process instabilities. We will experience, that if a quality control chart is selected incorrectly, there is always a risk that the control tests will react less sensitively to existing process instabilities. And in this context, we will also learn how an overall process can be divided into two sub-processes by using the useful function: Form subset of worksheet. With the knowledge we have learned so far, we will become familiar with the so-called moving range chart, commonly referred to as the M-R chart. And we will learn, that the combined individual and moving range chart, I-M-R chart, is always very useful when individual values are to be compared with each other that are not summarized in subgroups.
MAIN TOPICS MINITAB TUTORIAL 24, part 1
- Assessment of the data landscape using descriptive statistics
- Process stability versus process capability
- Structure of control charts using the example of the I-chart and Xbar chart
- Identify process instabilities using tests for exceptional conditions
MAIN TOPICS MINITAB TUTORIAL 24, part 2:
- Process analysis using the combined Xbar/R- chart
- Identification of process instabilities using the control tests according to AIAG
- Manual derivation of the control limits in the S-map
- Manual derivation of the control limits in the Xbar map
- Manual derivation of the control limits in the R-map
- Plant-related process analysis through partial sub set formation
- Integration of customer specification limits and process target limits
- Working with the time stamp in control charts
- Division of an overall process into several sub-processes
- Alignment of scale labels in quality control charts
MAIN TOPICS MINITAB TUTORIAL 24, part 3:
- individual value chart I chart
- moving range chart MR chart
- Derivation of the control limits in the MR chart
- Derivation of the control limits in the I chart
Trailer
24 CONTROL CHARTS, CONTINUOUS DATA, PART 2
[digi_if product=“5,8″]
MAIN TOPICS MINITAB TUTORIAL 24, part 2:
- Process analysis using the combined Xbar/R- chart
- Identification of process instabilities using the control tests according to AIAG
- Manual derivation of the control limits in the S-map
- Manual derivation of the control limits in the Xbar map
- Manual derivation of the control limits in the R-map
- Plant-related process analysis through partial sub set formation
- Integration of customer specification limits and process target limits
- Working with the time stamp in control charts
- Division of an overall process into several sub-processes
- Alignment of scale labels in quality control charts
[/digi_if]
24 CONTROL CHARTS, CONTINUOUS DATA, PART 3
MAIN TOPICS MINITAB TUTORIAL 24, Part 3:
- individual value chart I chart
- moving range chart MR chart
- Derivation of the control limits in the MR chart
- Derivation of the control limits in the I chart
25 PROCESS STABILITY ATTRIBUTIVE DATA: P-, NP-, P`- CHART
25 PROCESS STABILITY ATTRIBUTIVE DATA: P-, NP-, P`- CHART
In the 25th Minitab tutorial, we are back in the final assembly department of Smartboard Company. Here, in the early late and night shifts, all the individual skateboard components are assembled into a finished skateboard, and subjected to a final automatic surface inspection before being shipped to the customer. Skateboards without surface damage are classified in the attributive category „good“, and can be sold. Skateboards with surface damage are classified in the attributive category „bad“, and either undergo cost-intensive reworking or in the worst case, have to be scrapped. The core topic in this training unit will be to learn how process stability can be investigated on the basis of this categorical data. To this end, we will first learn how the number of defective skateboards can be displayed chronologically in the form of a defect rate, by using a suitable quality control chart. We will then use the correct choice of quality control chart to assess whether the skateboard assembly process can be classified as a stable process from a qualitative perspective. In this context we will understand, that if our process data is only available in two attributive categories, as in this case in the attributive categories good part and bad part, quality control charts that take into account the laws of binomial distribution are always suitable. In this context, we will get to know the so-called quality control chart, P-chart. Before we can create the P-chart, we will first carry out a so-called P-chart diagnosis, to ensure that our data follows the laws of binomial distribution sufficiently well. Here we examine the important parameters, such as overdispersion and underdispersion, which provide us with information on how much the scattering behavior of our actual data landscape deviates from the scattering behavior of a theoretically ideal binomial distribution, and whether this deviation is still acceptable. With the knowledge we have gained up to this point, we will be able to decide in the context of the corresponding AIAG standard specifications, whether we should actually continue to work with the P-chart or whether we should use a modified P-chart, the so-called P-prime chart according to Laney due to an inadmissible over- or under-dispersion. In addition to the P- chart at the end of this training unit we will also get to know the so-called useful n-p- chart, which is also able to clearly and chronologically depict absolute proportions of defective units instead of relative proportions.
MAIN TOPICS MINITAB TUTORIAL
- p- chart: Diagnosis
- p- chart: Structure and principle
- p- chart analysis
- Working with identification variables
- Manual derivation of the upper and lower control limits in the p- chart
- np- chart: structure and principle
- np- chart analysis
- p`- chart according to Laney
Trailer
26 PROCESS STABILITY ATTRIBUTIVE DATA: U-, C- CHART
26 PROCESS STABILITY ATTRIBUTIVE DATA: U-, C- CHART
In the 26th Minitab tutorial, we are in the final assembly department of Smartboard Company. Here, all individual skateboard components are currently assembled into a finished skateboard in the early late and night shifts, and then subjected to an automatic surface inspection before dispatch to the customer in order to check that no surface damage in the form of scratches, was caused during assembly. In the past, skateboards without surface scratches were classified in the „good“ quality category and could be released to customers. Accordingly, skateboards with surface damage were classified in the „poor“ quality category, and therefore either had to be reworked at great expense or, in the worst case scrapped. In order to be able to record the extent of surface damage in a more differentiated way in the future, the number of surface scratches has also been recorded by the automatic surface inspection system. In this Minitab tutorial, we will therefore learn to map the number of scratches detected on each product using a quality control chart, and to analyze whether the assembly process can be classified as a stable process in terms of the number of scratches.
In contrast to the training unit, in which we used the p and np chart, to set the number of bad parts in relation to the respective sample subgroup, and were able to carry out our stability analysis using the statistical laws of binomial distribution, this practical scenario now deals with the case, where the number of events on a product, in our case the number of scratches on a skateboard, is the focus of our stability analysis. We will learn that we are then dealing with Poisson distributed quality data. The central learning objective is to map the frequency of events, in our case the number of scratches on the skateboards by using a corresponding quality control chart and to analyze the assembly process with regard to its process stability. In this context, we will get to know the so-called u-chart, and c-chart, and learn how we can use a corresponding u-chart diagnosis, to check whether the scattering behavior of our data set also follows the laws of Poisson distribution sufficiently well. We will also understand how we can manually estimate the corresponding control limits according to the AIAG standard specifications. Based on our analysis results, we will then be able to derive appropriate improvement measures to improve process stability. We will then carry out another process stability analysis, based on the improved process, and compare the process stability of our improved process with the process stability of the original unimproved process. We will learn how to use the useful „Stages“ option, to divide an existing overall process into sub-processes, and thus also obtain the correct sub-process-related control limits. In the last part of this Minitab tutorial, we will also get to know the very useful so-called c- chart, on another data set consisting of constant subgroup sizes and understand, that the c- chart in contrast to the u- chart, is able to map the absolute event frequencies per subgroup.
MAIN TOPICS MINITAB TUTORIAL
- u- chart: Fundamentals
- u- chart diagnosis
- u- chart analysis
- Manual derivation of the control limits in the u- chart
- Division of the overall process into two sub-processes using the u- chart
- c- chart principle
- c- chart analysis
- Manual derivation of the control limits in the c- chart